Portfolio / Revenue Leakage Analysis
Portfolio · Dermatology
Revenue Leakage Analysis
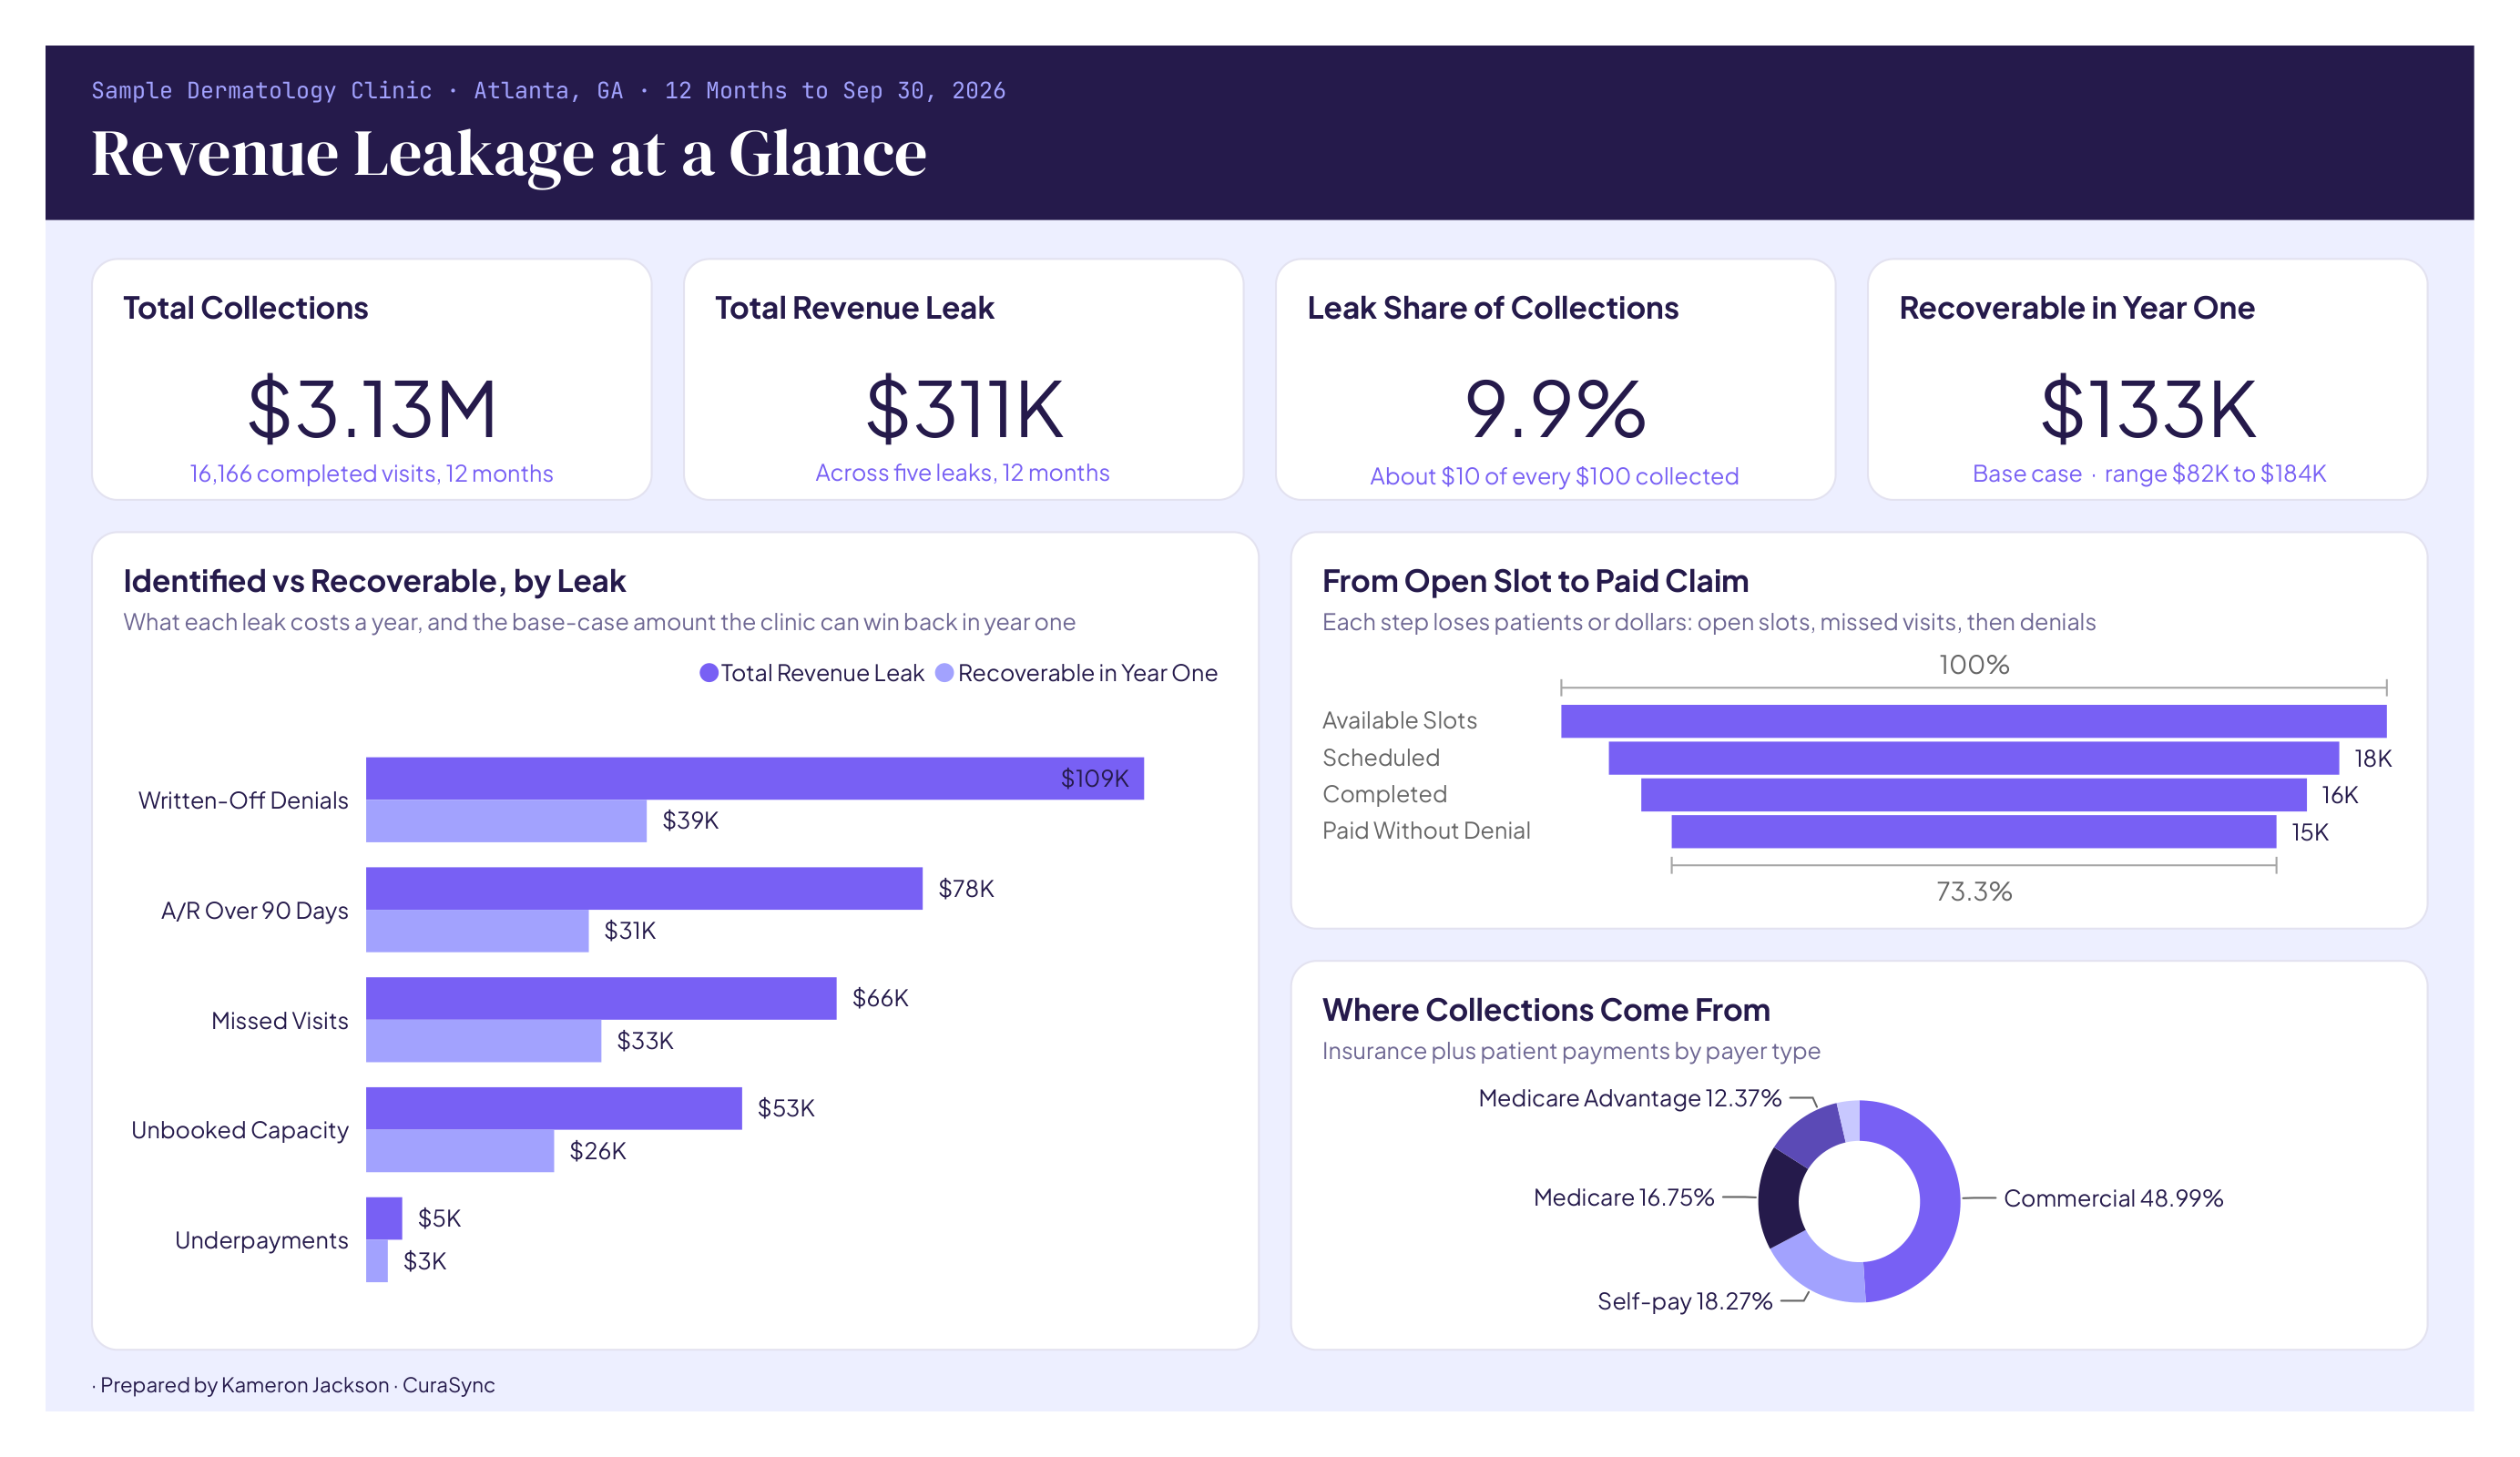
Finding $311K in a three-provider dermatology practice’s revenue cycle. The practice was busy but short on cash, and the owner asked: where is revenue slipping, and what should we fix first?
In short
The result
$311K
Revenue leak found
Across five leaks; includes a point-in-time A/R balance.
$133K
Realistic year-one recovery
Range $82K–$184K.
$3.13M
Yearly collections
16,166 completed visits.
9.9%
Denial rate
Share of insurance claims denied.
Sample data built from public benchmarks. The clinic is fictional. As of Sep 30, 2026.
The approach
Real prices, simulated clinic, checked twice
- REAL
Every visit priced at 2026 Medicare rates from the CMS fee schedule.
- BENCHMARK
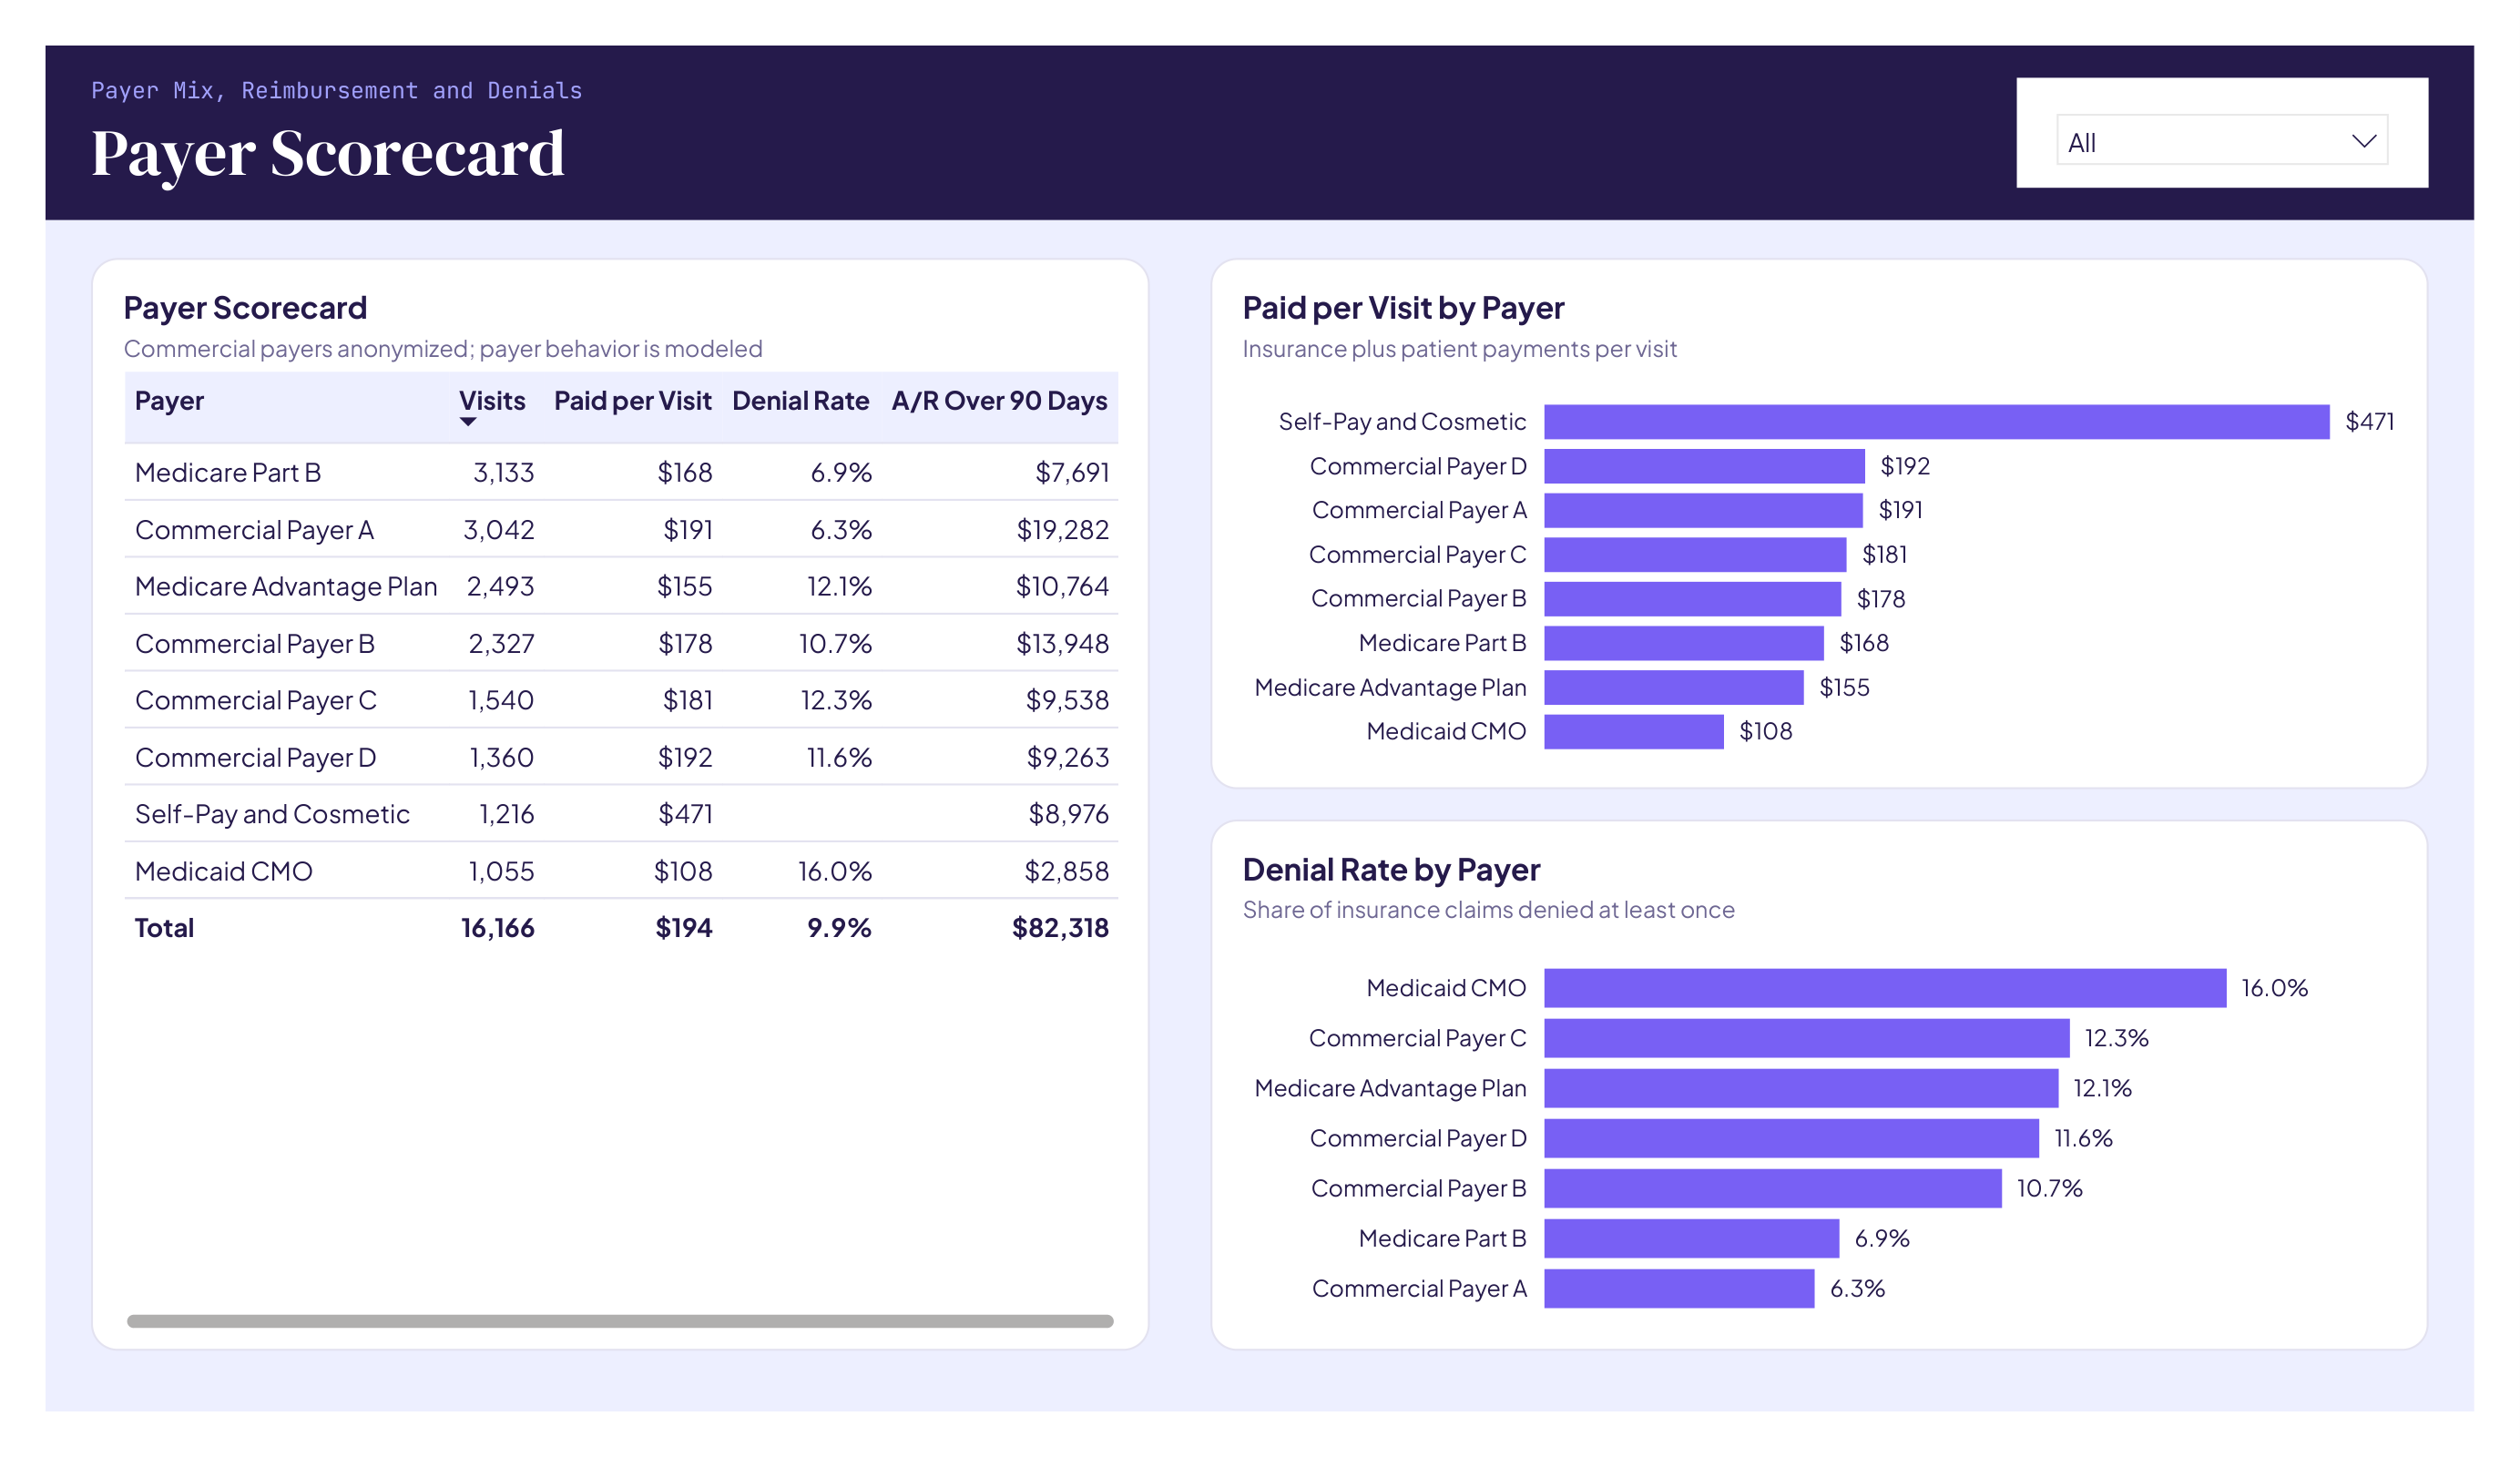
Payer denial patterns ranked from CMS Transparency in Coverage data; goals from MGMA and HFMA.
- MODELED
One simulated year of visits, claims, payments and unpaid balances.
How we checked the numbers
- 01One pipeline computes every metric once, so the dashboard, one-pager and this page always agree.
- 02An independent validator recomputes each headline figure from the raw tables: 47 automated checks.
- 03Nothing ships while a single check fails.
What we found
Five leaks, ranked by dollars
- Written-Off Denials$109K
- A/R Over 90 Days$78K
- Missed Visits$66K
- Unbooked Capacity$53K
- Underpayments$5K
Total found: $311K. Realistic year-one recovery: $133K. Sample data; the clinic is fictional.
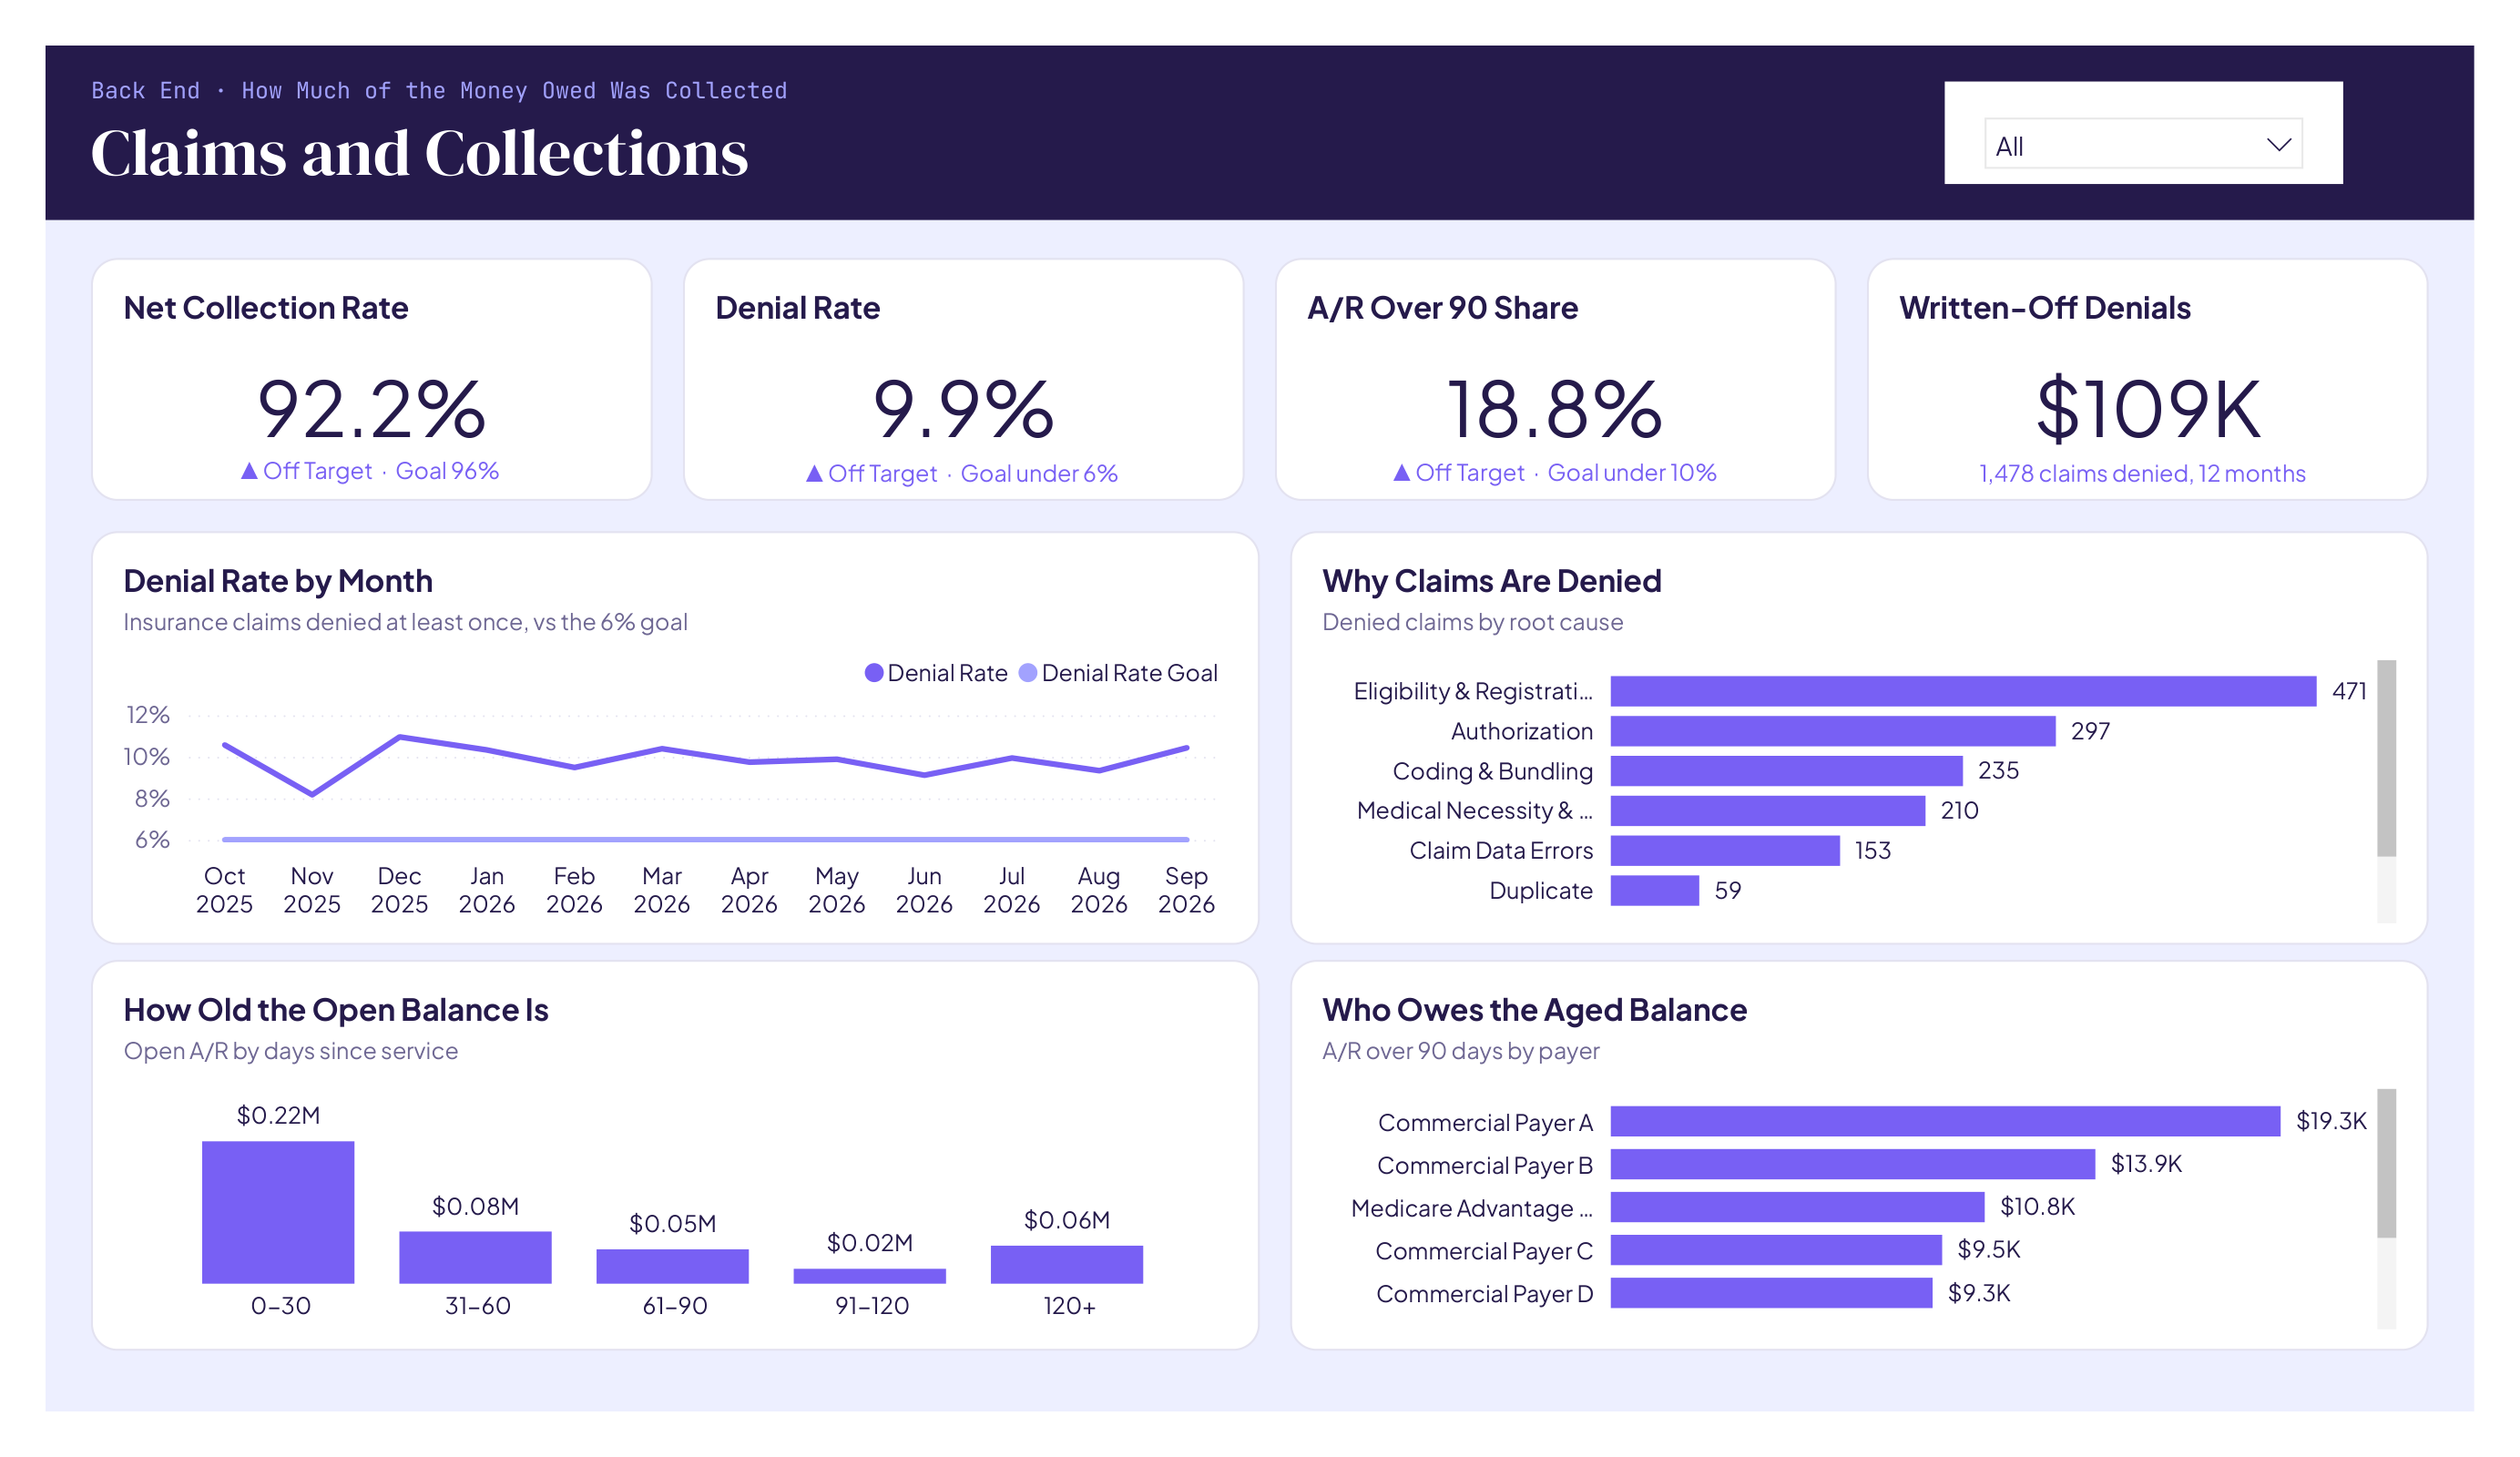
- Denials cost the clinic $109K in write-offs this year, and 768 of 1,478 denials trace to missing prior auth or eligibility errors that a pre-visit check would catch.
- $82K sits unpaid for more than 90 days ($78K after setting aside underpayments), which is 18.8% of all open balances against an industry goal under 10%.
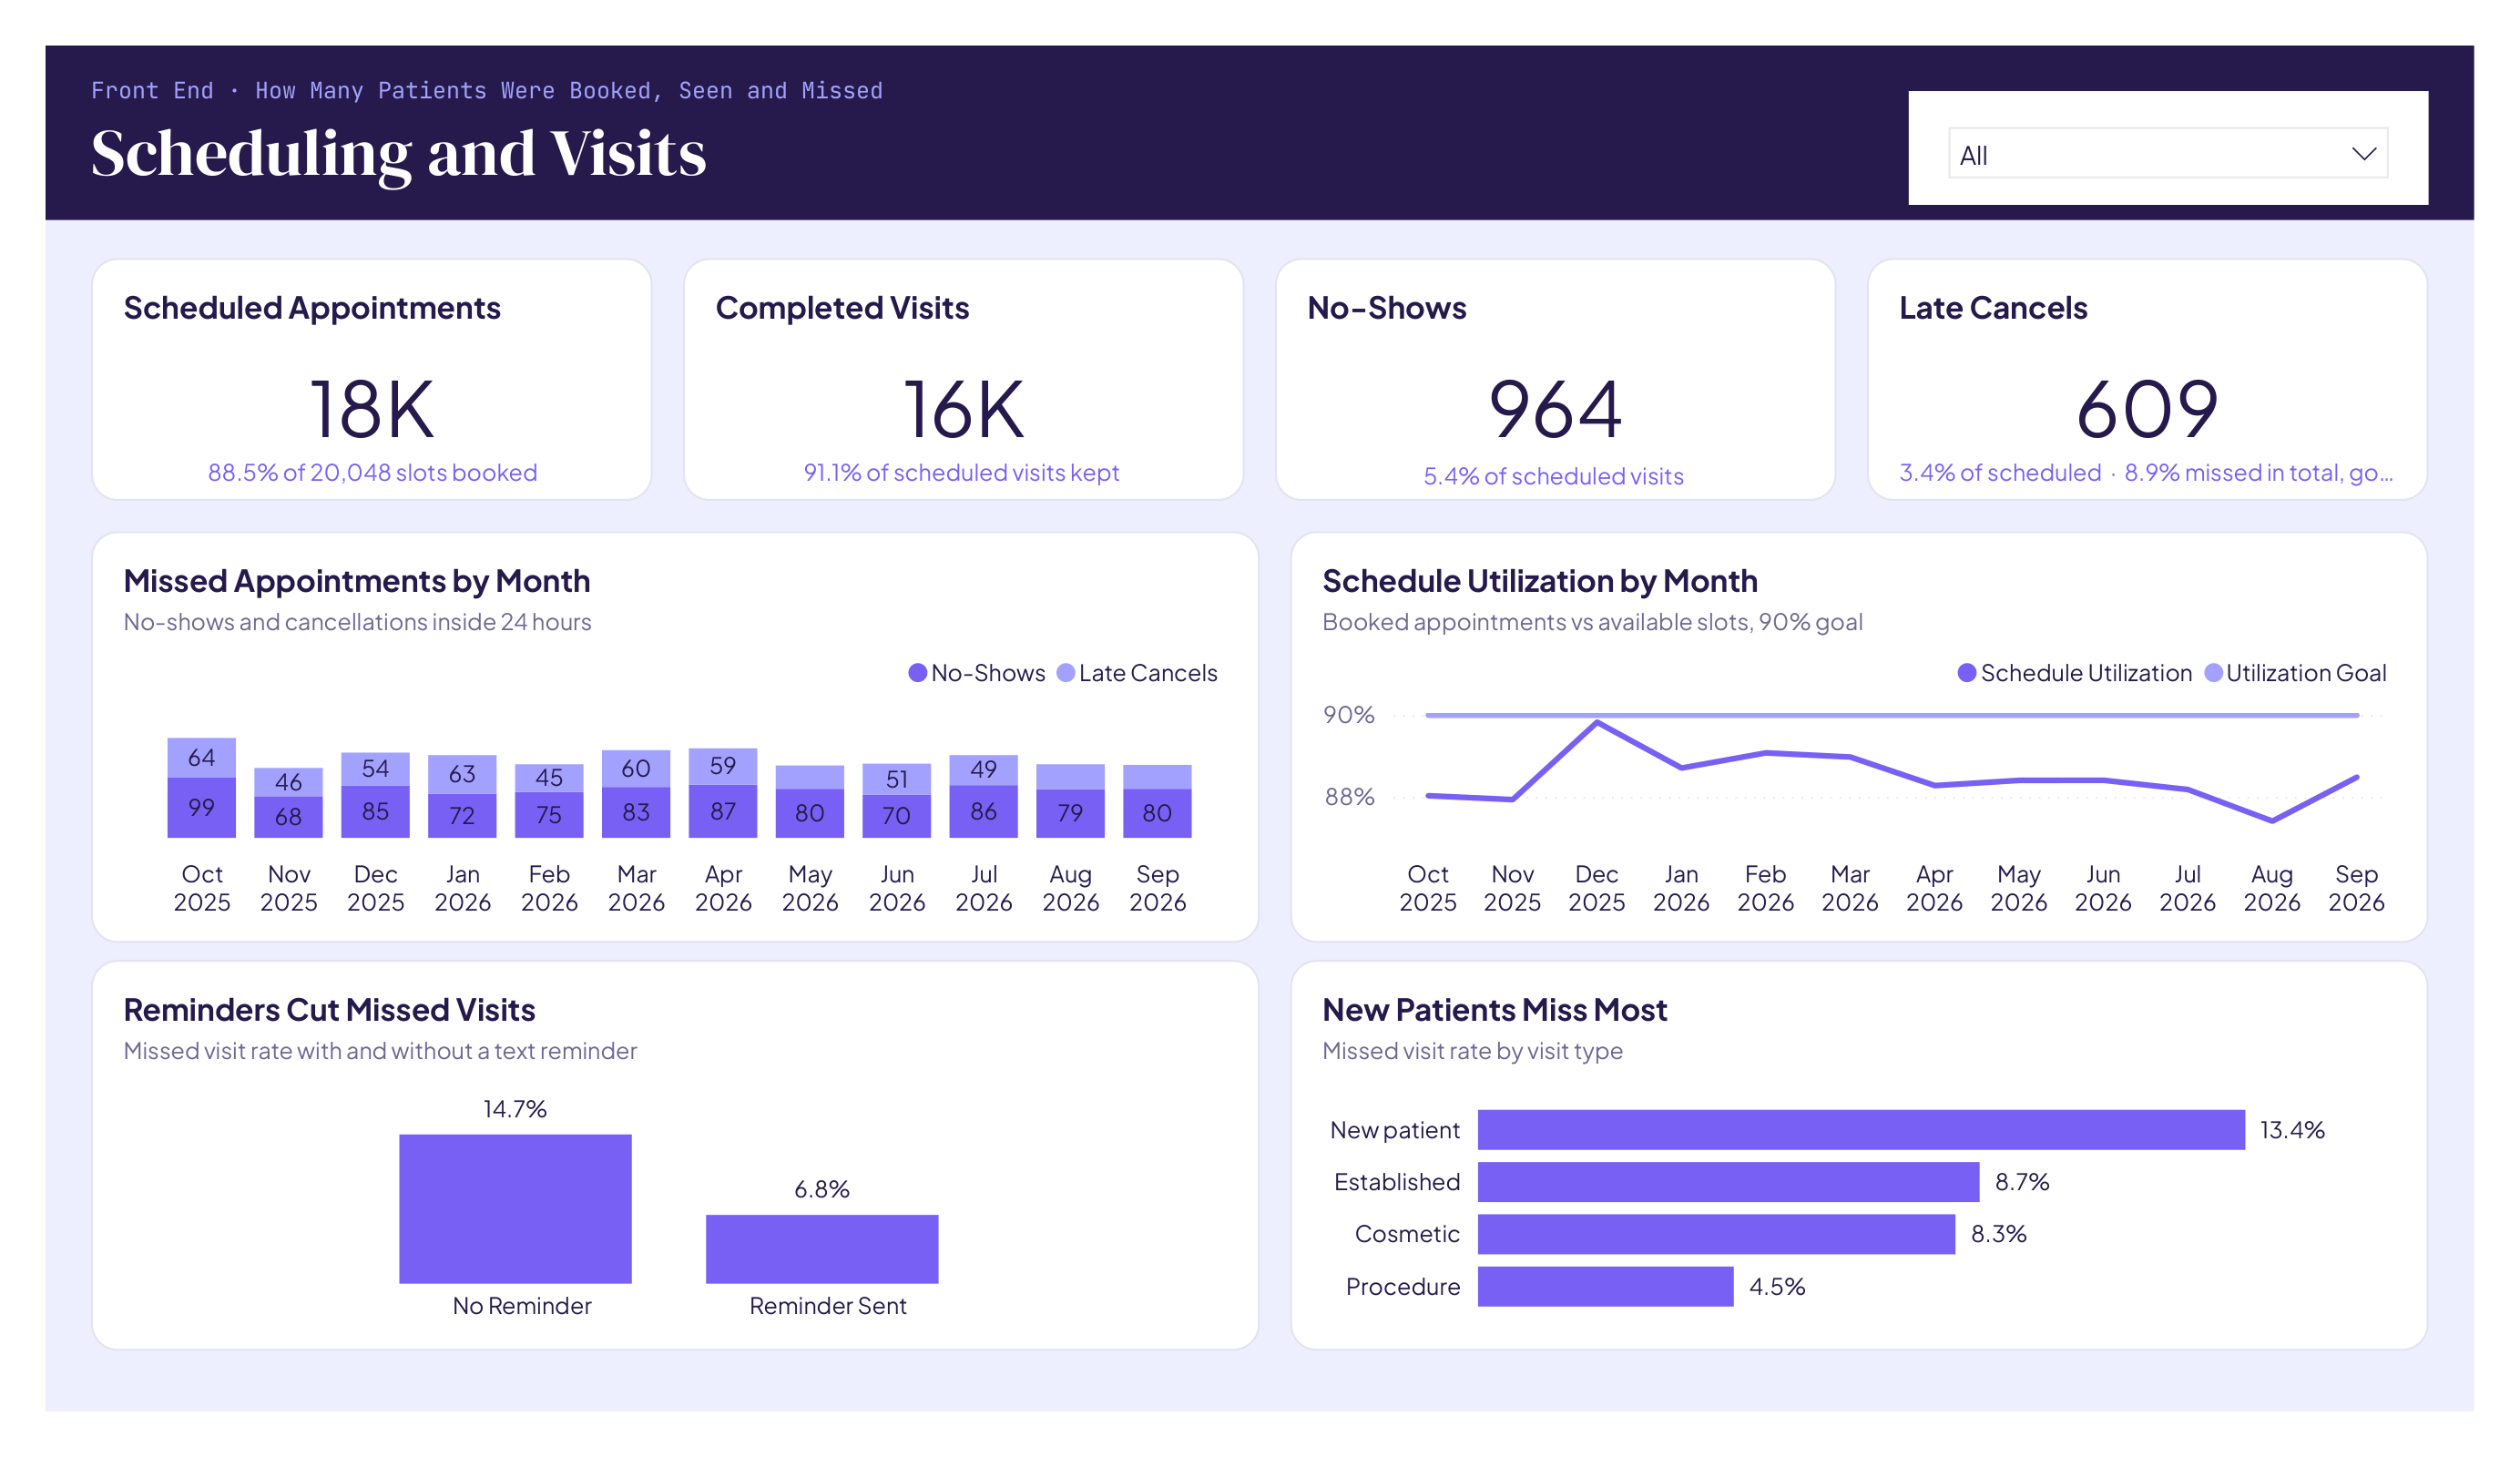
- Bringing missed visits down to 7% and booking 90% of slots would add $119K a year, and new patients miss 13% of their appointments versus 9% for established patients.
| Leak | What it looks like | Found | Year-one recovery | Owner |
|---|---|---|---|---|
| Written-Off DenialsClaims the payer denied that were written off instead of fixed and resubmitted. | A Mohs case done without prior auth. A new patient whose coverage ended last month. | $109K | $39K | Prior Auth Coordinator |
| A/R Over 90 DaysMoney owed to the practice that has sat unpaid for more than 90 days. | A stack of aging claims nobody owns, getting closer to the filing deadline every week. | $78K | $31K | Billing Manager |
| Missed VisitsBooked visits lost to no-shows and late cancellations, above a 7% goal. | Gaps in a full-looking schedule. New patients missing more often than established ones. | $66K | $33K | Front Desk Lead |
| Unbooked CapacityProvider time that was open but never booked, below a 90% booking goal. | A waitlist for new patients and empty slots on the same day. | $53K | $26K | Practice Administrator |
| UnderpaymentsClaims the payer paid, but for less than the contracted rate. | Payments posted without anyone comparing them to the contract. | $5K | $3K | Billing Specialist |
| Total | $311K | $133K ($82K–$184K) |
Sample data built from public benchmarks. The clinic is fictional. As of Sep 30, 2026.
What we recommend
The 30-day plan
Week one needs no new software. Every action has an owner and a measure.
| Week | Action | Owner | Est. Recovery |
|---|---|---|---|
| 1 | Build a prior auth log for Mohs and procedure visits and confirm auth before the visit is kept. | Prior Auth Coordinator | $30K |
| 1 | Run eligibility checks on every new patient two business days before the visit. | Front Desk Lead | $10K |
| 1 | Turn on 3-day and 1-day text reminders for all bookings, including short-notice ones. | Front Desk Lead | $23K |
| 2 | Start a weekly aged-claim queue for balances over 90 days, sorted by dollars. | Billing Manager | $31K |
| 2 | Require a second review before any denial is written off. | Billing Manager | Enables Others |
| 3 | Load contracted rates into the billing system and flag payments below contract. | Billing Specialist | $3K |
| 3 | Keep a same-day waitlist and release open slots to new patients 72 hours out. | Practice Administrator | $36K |
| 4 | Review the scorecard with providers and reset 12-month goals. | Practice Administrator | Enables Others |
Recovery range and assumptions
Base case assumes the clinic recovers 50% of the missed-visit gap, 50% of unbooked capacity, 50% of the auth and eligibility write-offs, 40% of A/R over 90 days and 60% of underpayments in year one.
The $82K to $184K range uses 30% to 70% of the missed-visit gap, 25% to 75% of unbooked capacity, 35% to 65% of auth and eligibility write-offs, 25% to 55% of aged A/R, 40% to 80% of underpayments. These are modeled assumptions, not guarantees.
Deliverables
The Power BI report and one-pager you receive
Power BI report
Documents
The two-minute read for the owner.
Findings, a 30-day plan with an owner for every fix, and a scorecard, on one letter page. It travels with the Power BI report, which also comes as a PDF export for anyone without Power BI.
Power BI report (PDF)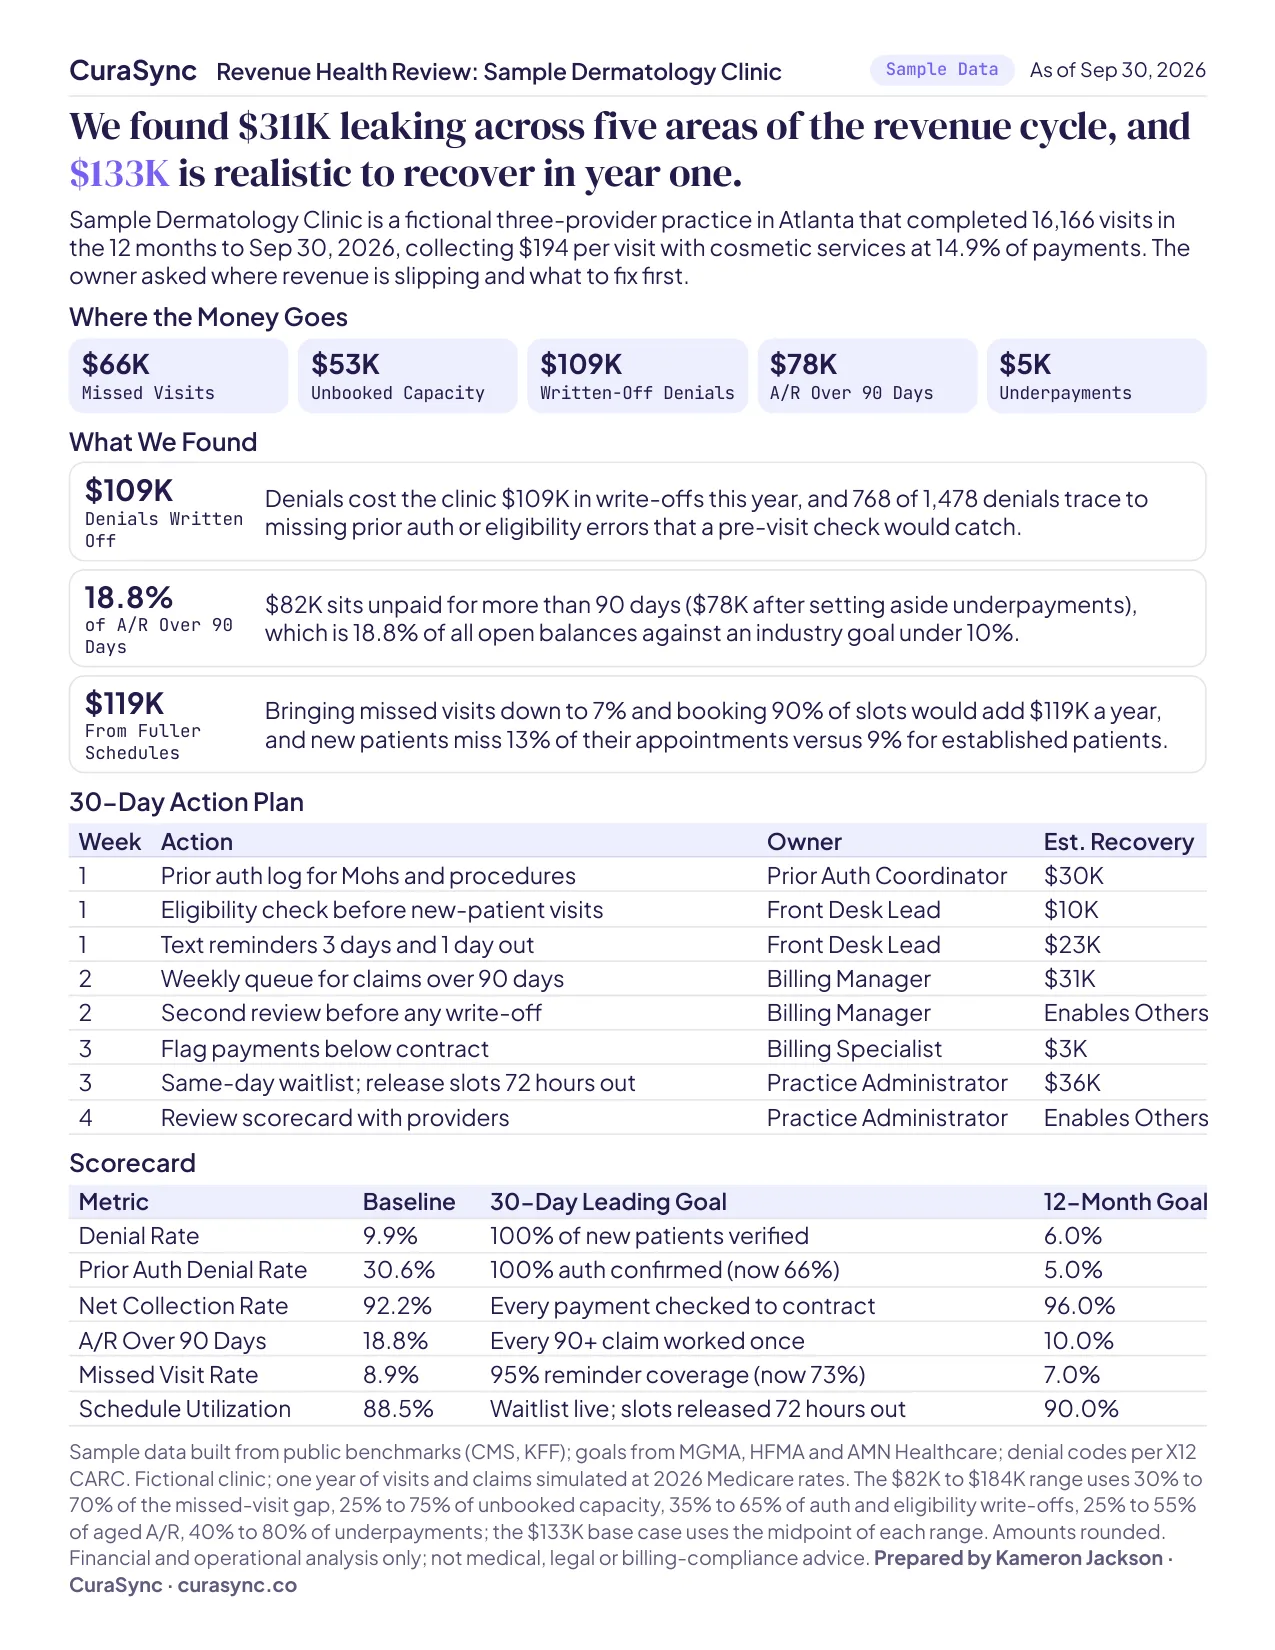 PDF
PDFSources
Sources and provenance
- CMS 2026 Physician Fee Schedule (RVU26D)
- CMS Medicare Physician and Other Practitioners 2024
- CMS Transparency in Coverage public use file
- KFF analysis of marketplace claim denials
- X12 Claim Adjustment Reason Codes
- MGMA
- HFMA
- AMN Healthcare 2025 wait-time survey
CPT codes are shown by number with plain-language labels. This analysis is financial and operational only; it is not medical, legal or billing-compliance advice.
Want this for your organization?
Send five standard reports and get your leaks in dollars, with a 30-day plan.
Free Consultation