Portfolio / Payer Rate Benchmark
Portfolio · Physical therapy
Payer Rate Benchmark
Is this physical therapy practice paid fairly? Most practices sign a fee schedule and never look at it again. The owner asked: am I paid less than other practices for the same work, by the same insurer?
In short
The result
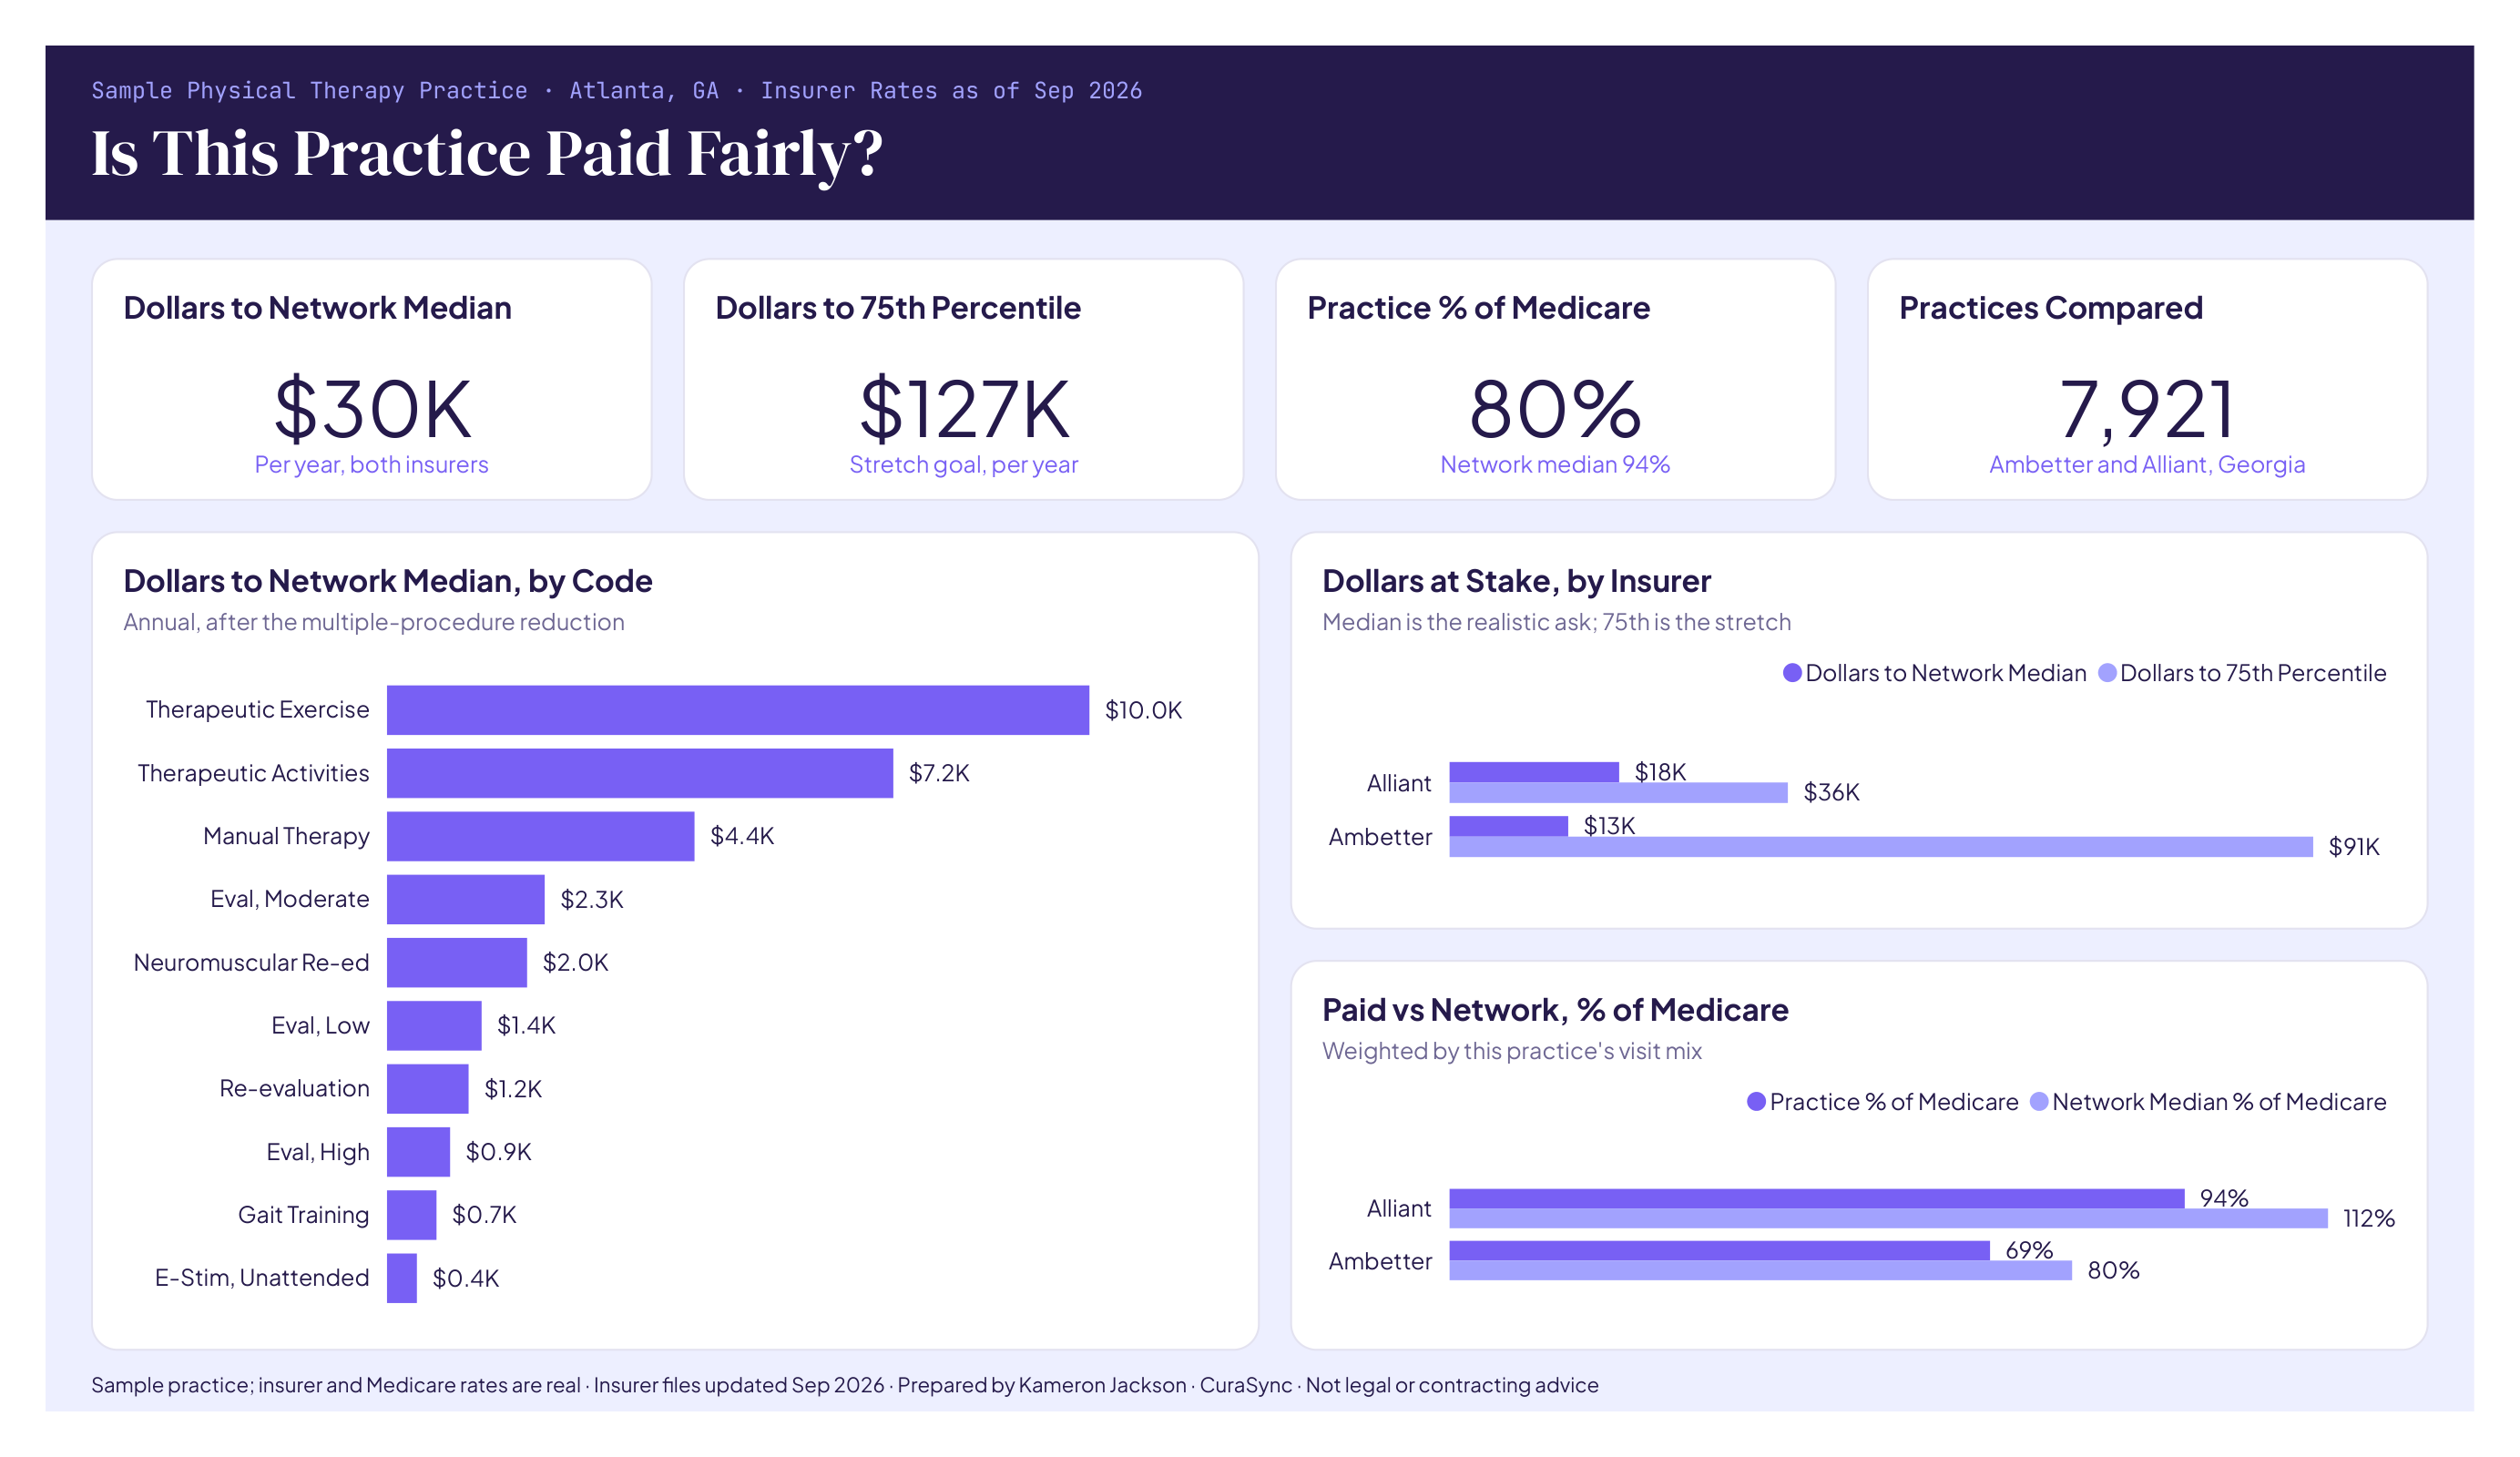
$30K
A year to network median
Both benchmarked contracts, after the multiple-procedure reduction.
$127K
At the 75th percentile
A stretch goal: about a third of practices sit on a higher pay tier.
94%
Alliant pays, % of Medicare
Network median: 112%.
7th
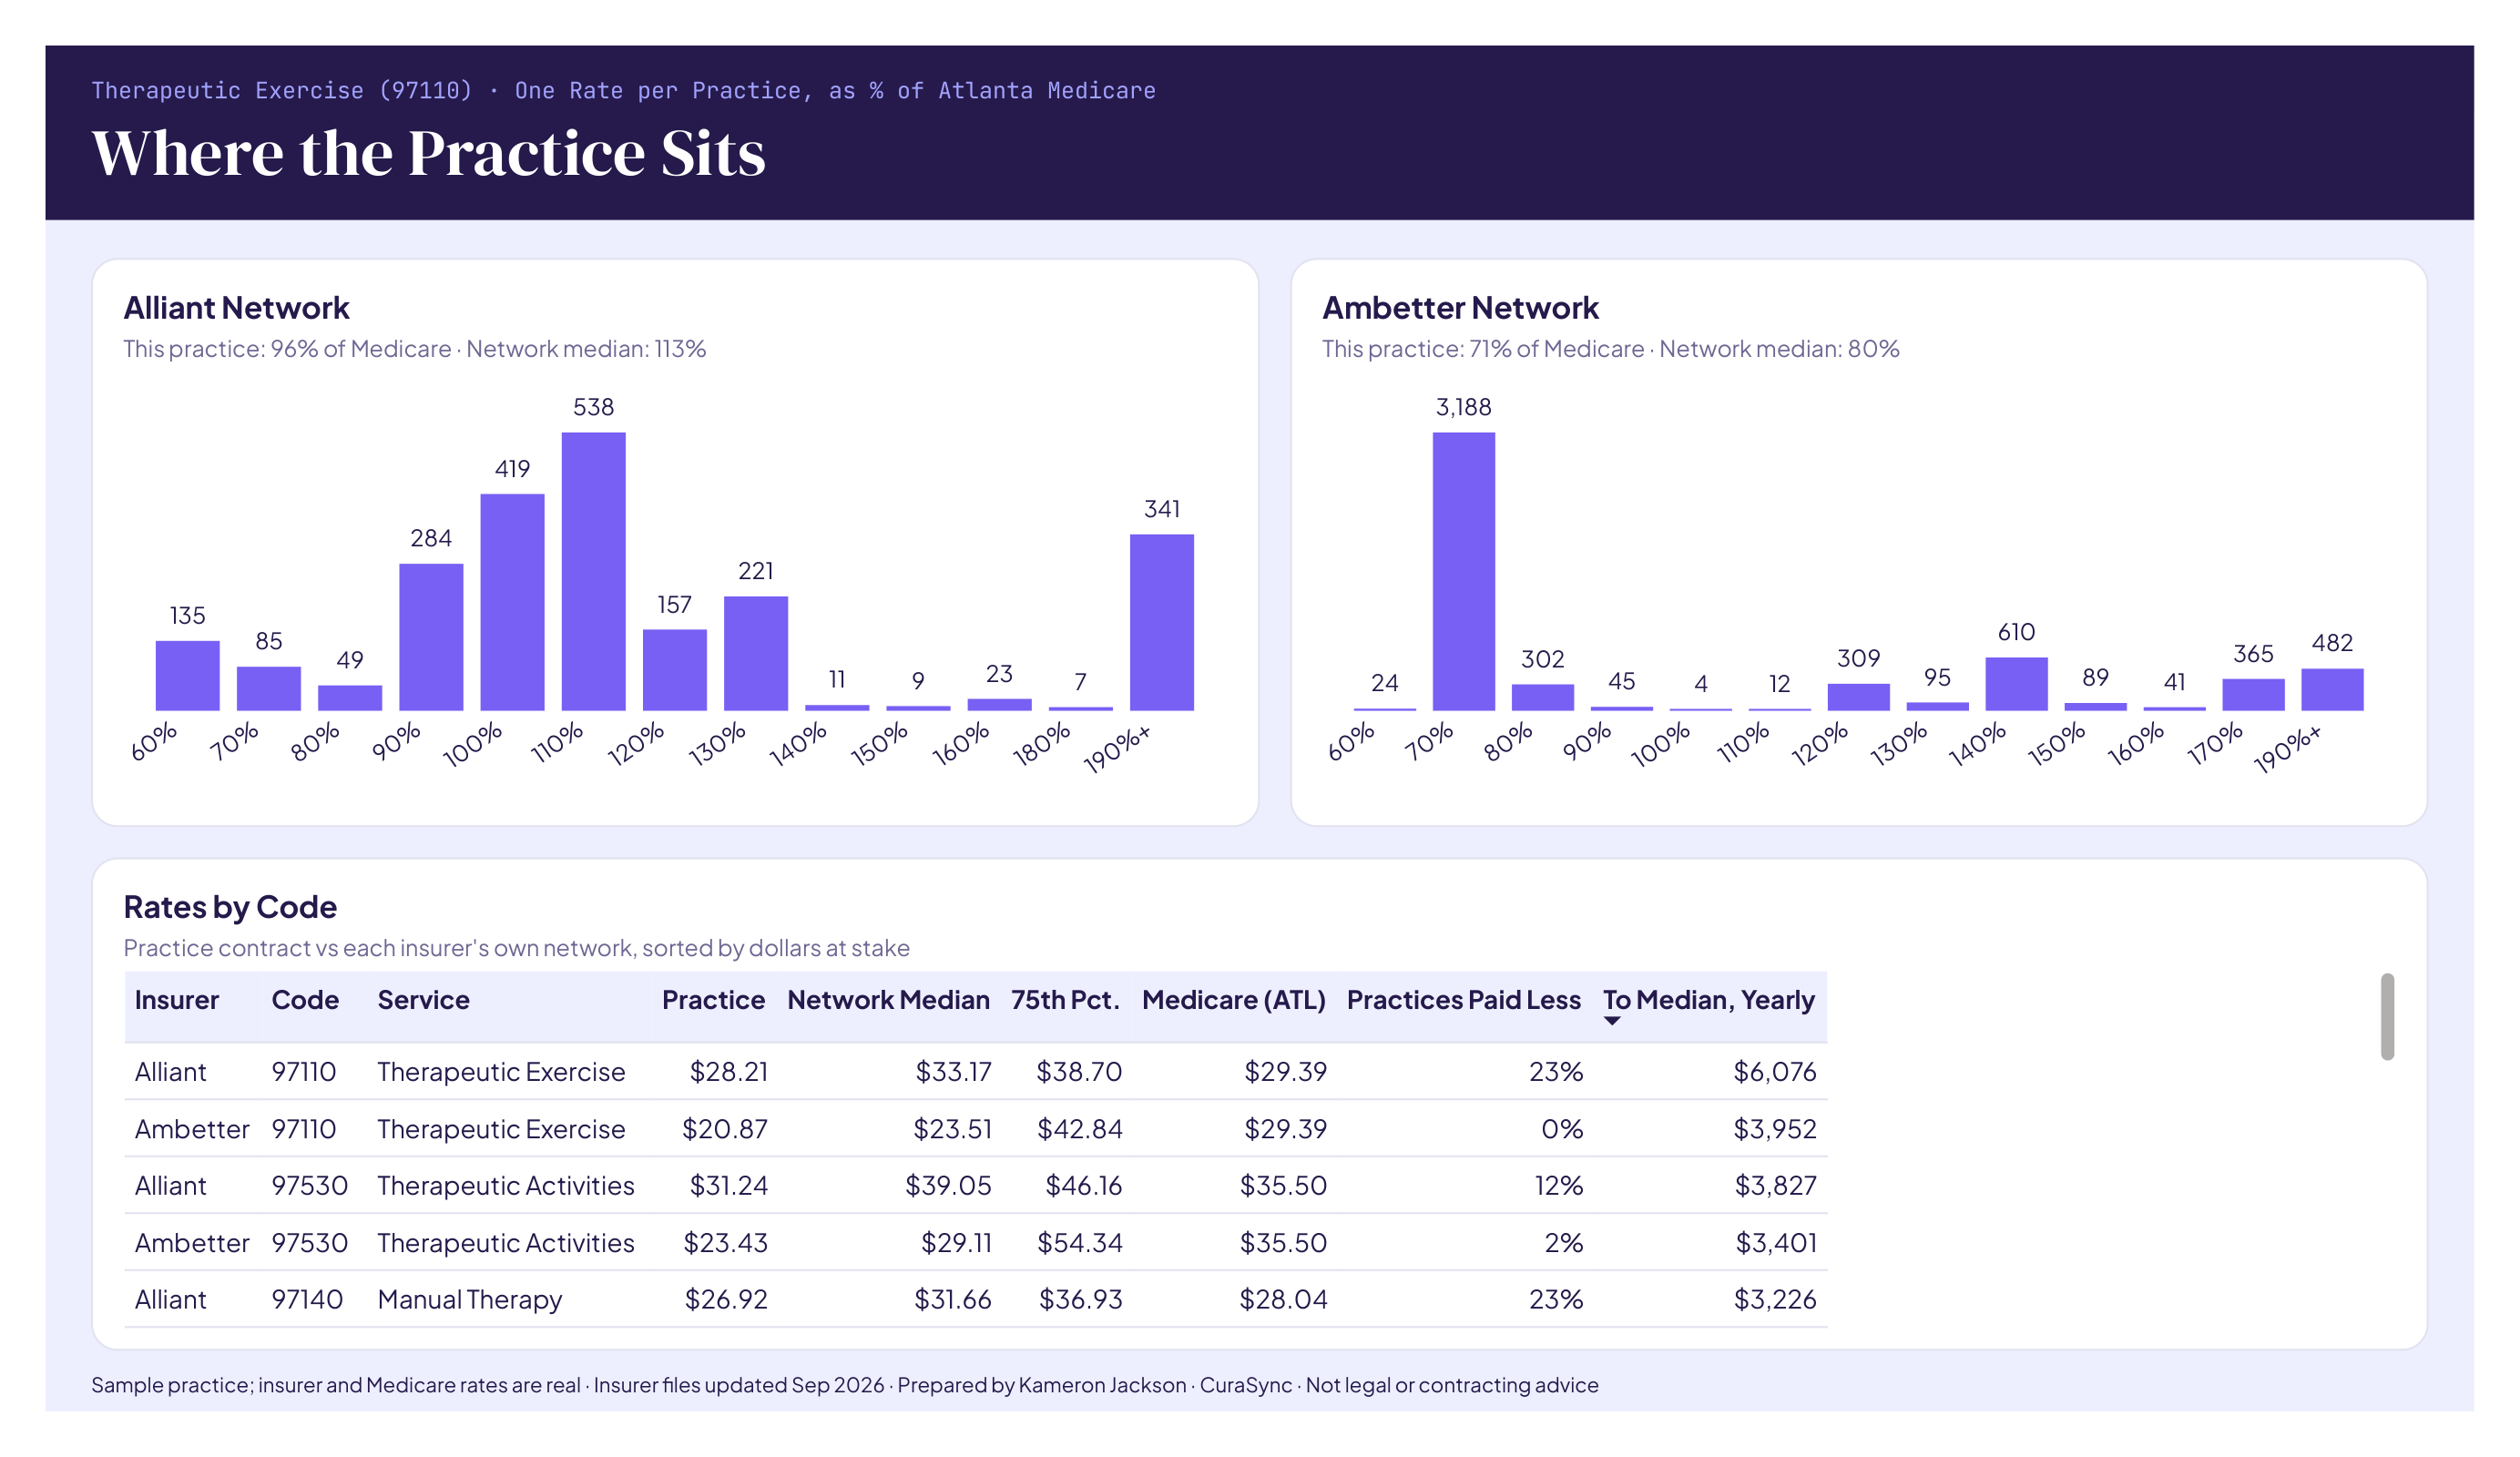
Percentile in Ambetter’s network
69% of Medicare vs an 80% median.
Sample practice; the insurer and Medicare rates are real. As of Sep 30, 2026.
The approach
Real market, fair yardstick, checked twice
- REAL
Insurers’ own rates
163,506 physical therapy rate rows streamed from Ambetter and Alliant Georgia rate files (about 1.1 GB), kept to office-based, fee-for-service rates, one median per practice.
- REAL
One yardstick
Every rate also shown as a share of 2026 Medicare for the Atlanta locality, so codes and insurers compare on one scale.
- REAL
How claims actually pay
Dollars apply Medicare’s 50% reduction on additional therapy units (14% on a typical visit), so estimates reflect payment, not list price.
- MODELED
The sample practice
A fictional 11,800-visit practice: its contracts, payer mix and visit mix are modeled. The market it is compared against is not.
What we found
Two contracts below the middle of their own networks
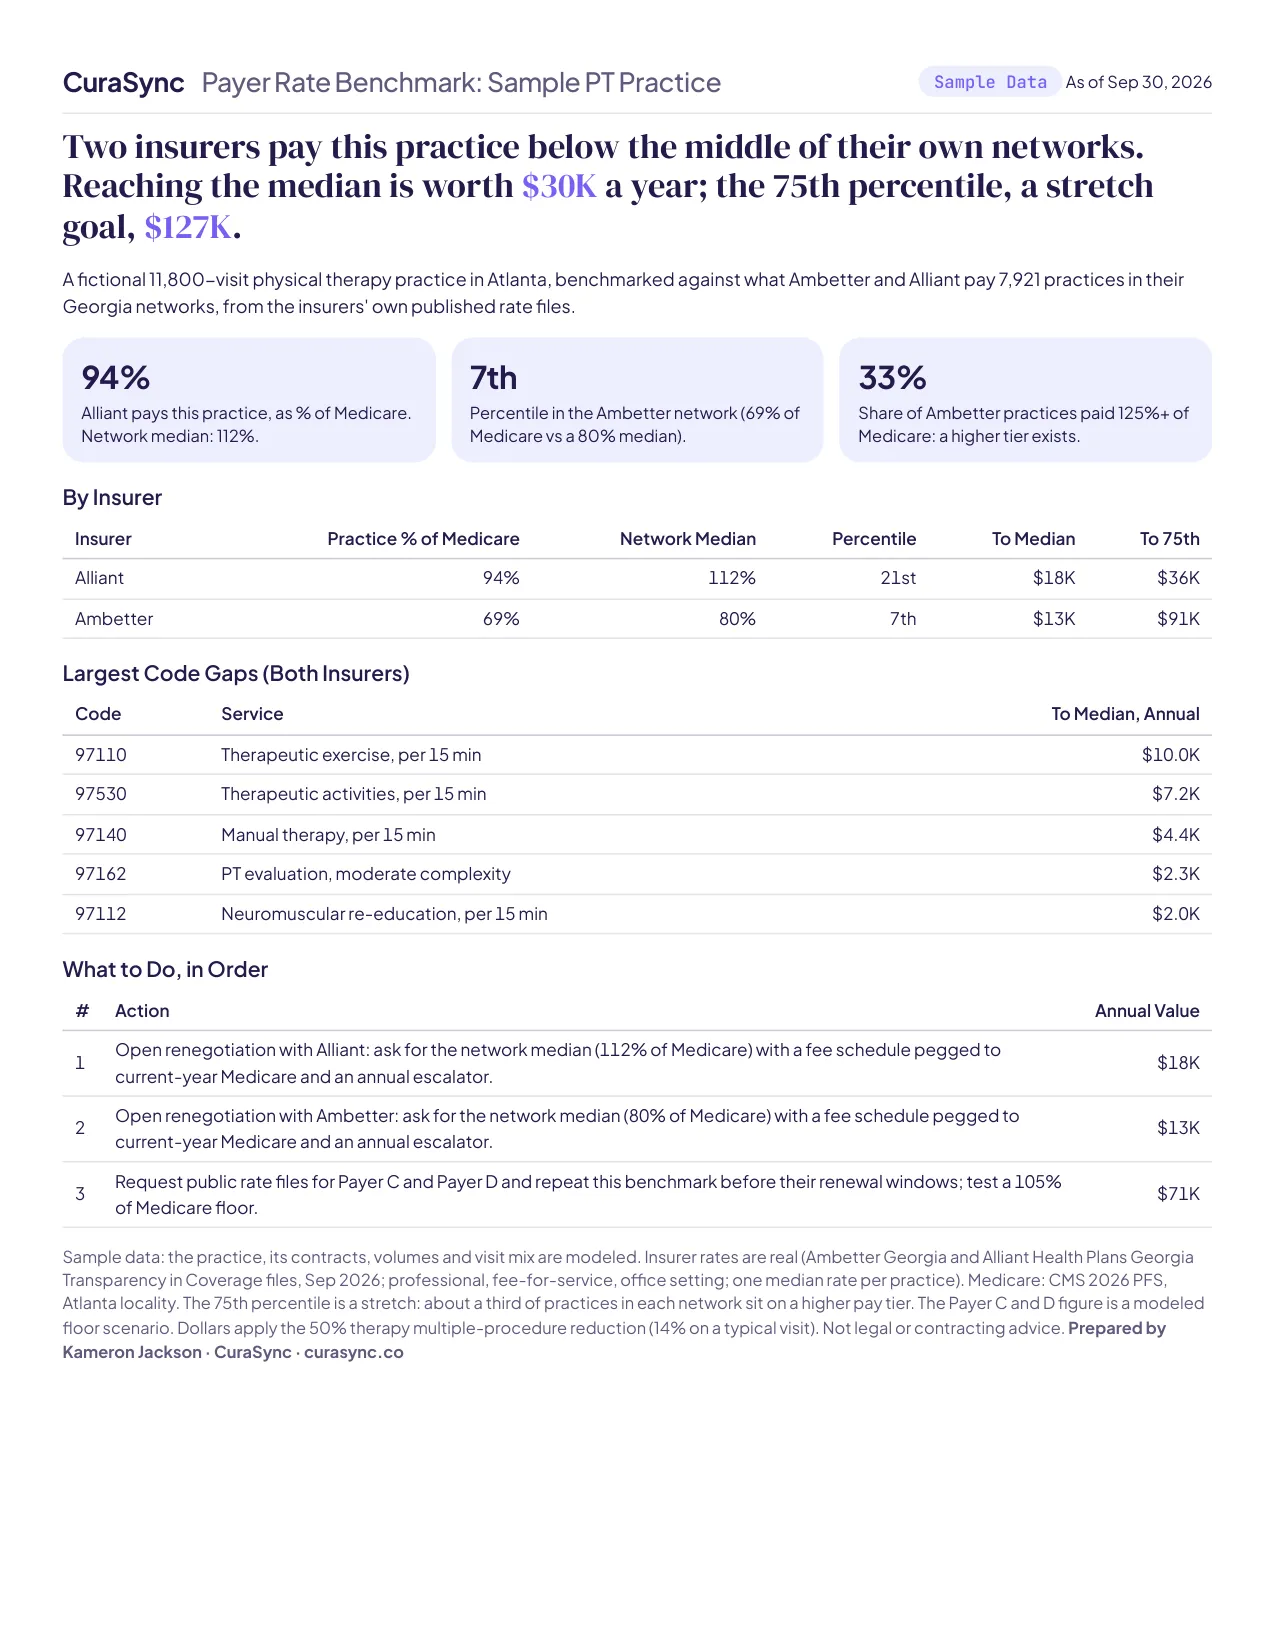
| Insurer | Practice | Network median | Percentile | To median | To 75th |
|---|---|---|---|---|---|
| Alliant | 94% | 112% | 21st | $18K | $36K |
| Ambetter | 69% | 80% | 7th | $13K | $91K |
Practice and median as a share of Atlanta Medicare for this practice’s visit mix. Percentile among 7,921 practices across both networks.
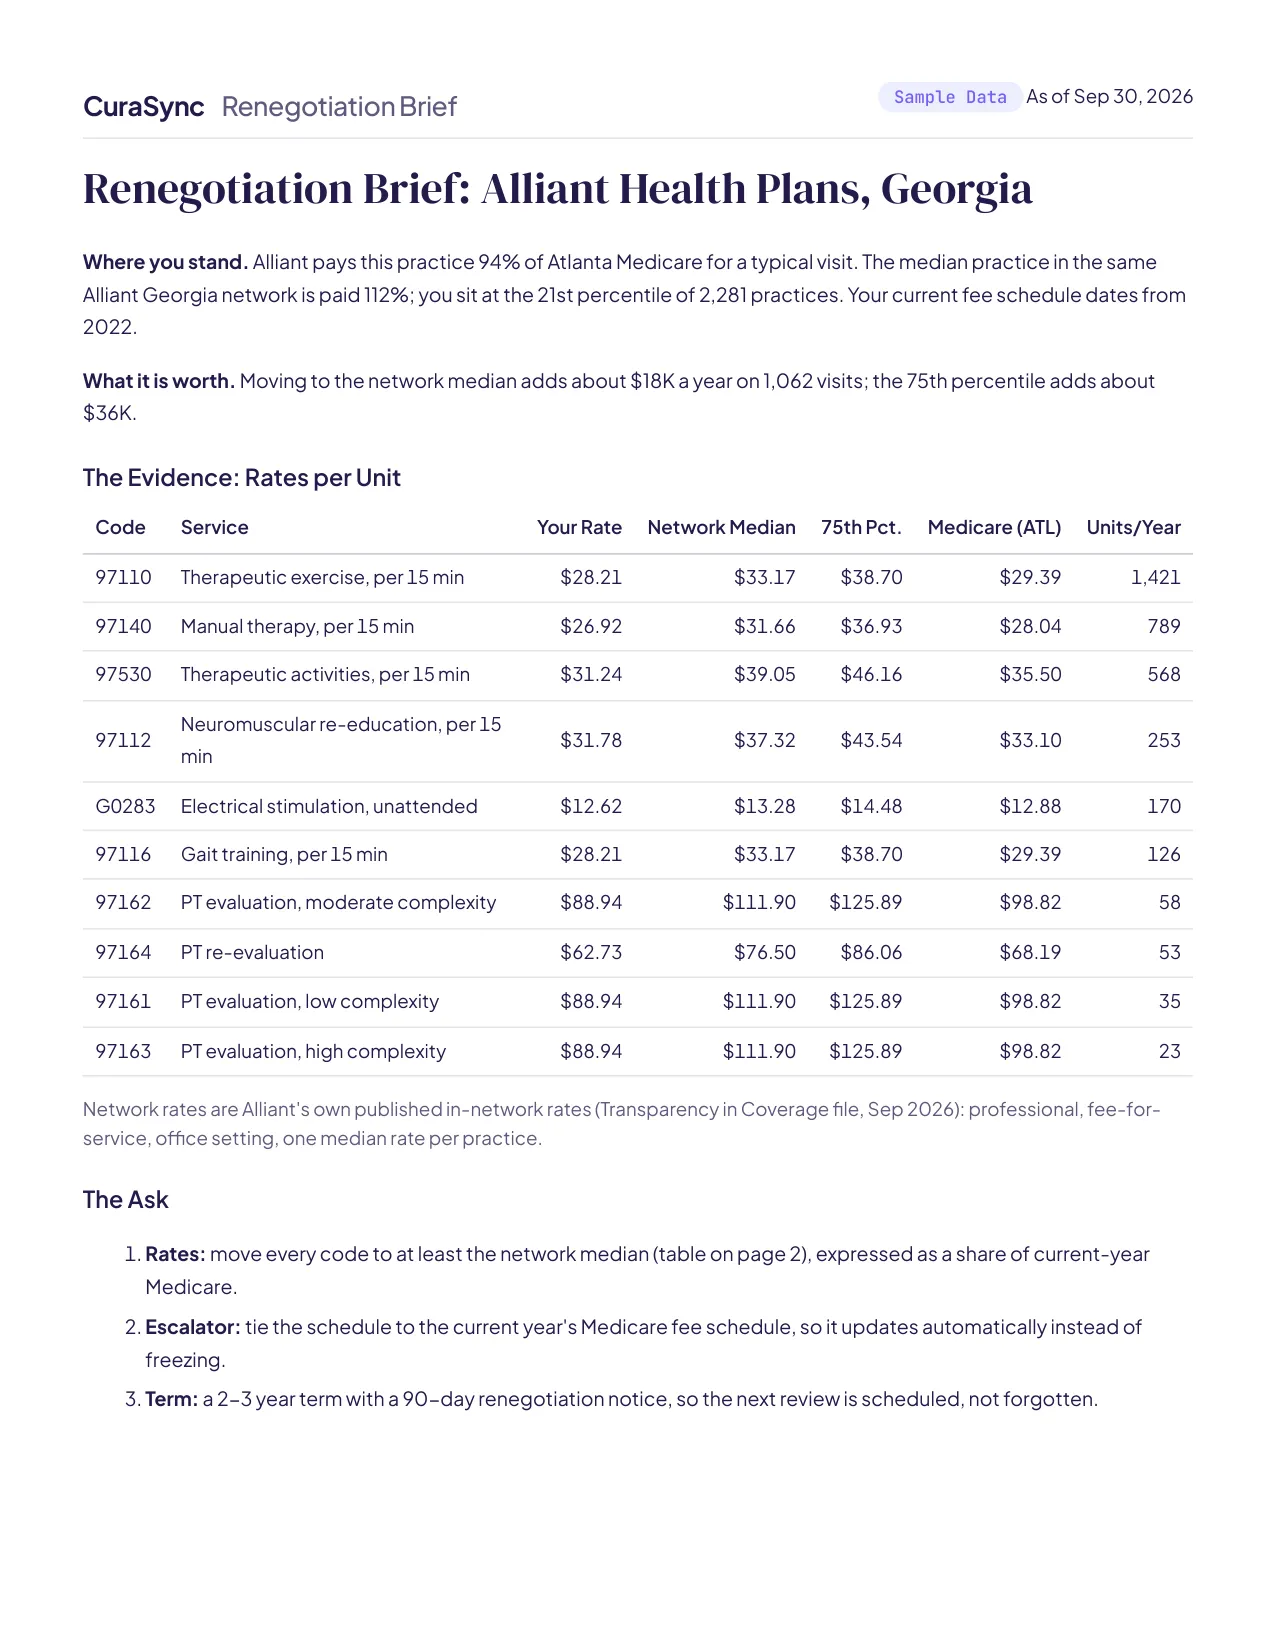
- Alliant pays this practice 94% of Medicare for a typical visit, while the median practice in the same Alliant network gets 112%. The practice sits at the 21st percentile of 2,281 practices.
- Moving the two benchmarked contracts to the market median is worth about $30K a year; reaching the 75th percentile is worth about $127K.
- 97110 (therapeutic exercise, per 15 min) carries the largest gap, $10K a year, because it is the most-billed unit and the most under-priced.
What we recommend
What to do, in order
- 01$18K
Open renegotiation with Alliant: ask for the network median (112% of Medicare) with a fee schedule pegged to current-year Medicare and an annual escalator.
Current fee schedule dates from 2022.
- 02$13K
Open renegotiation with Ambetter: ask for the network median (80% of Medicare) with a fee schedule pegged to current-year Medicare and an annual escalator.
Current fee schedule dates from 2021.
- 03$71K
Request public rate files for Payer C and Payer D and repeat this benchmark before their renewal windows; test a 105% of Medicare floor.
Sources
Sources and provenance
- CMS 2026 Physician Fee Schedule, RVU26D, and CY 2026 GPCIs (Georgia locality 01, Atlanta)
- CMS Therapy Services: 50% multiple procedure payment reduction on therapy practice expense
- Ambetter (Centene) Georgia in-network rate file, Transparency in Coverage (updated Sep 28, 2026)
- Alliant Health Plans Georgia in-network rate file, Transparency in Coverage (updated Sep 8, 2026)
CPT codes are shown by number with plain-language labels. No practice tax IDs or clinician identifiers are published. Financial and operational analysis only; not legal or contracting advice.